

An analysis of the budget4cast project database, shows two key facts about the use of Project Contingency Budgets by our user base:
- A fairly high proportion of all project budgets managed in budget4cast do in fact have a Contingency Budget: 65.4% of all projects managed in the app have at least some portion of the budget currently reserved for Contingency.
- budget4cast‘s users generally utilize a lower percentage of total project towards contingencies, than the industry average. (See chart below.)
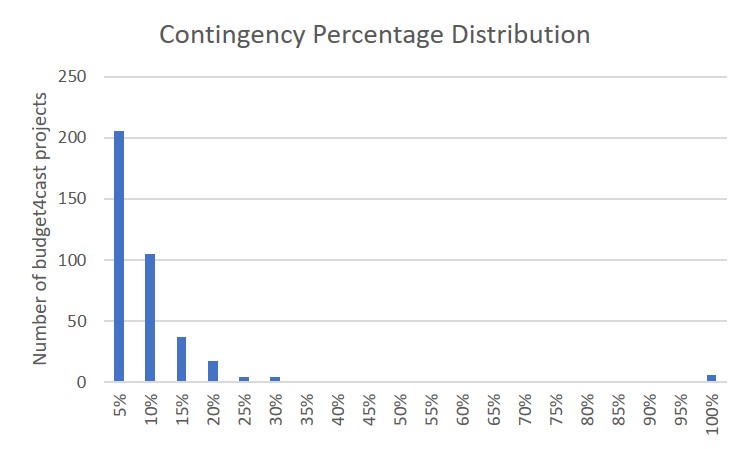
The histogram to the right show the distribution of the Contingency Percentage (Contingency Budget / Total Project Budget) for projects managed within our project budget management app. Note that over 80% of all projects managed in budget4cast have a Contingency Percentage 10% or less. The median Contingency Percentage utilized, across all projects managed in budget4cast is 4.4%.
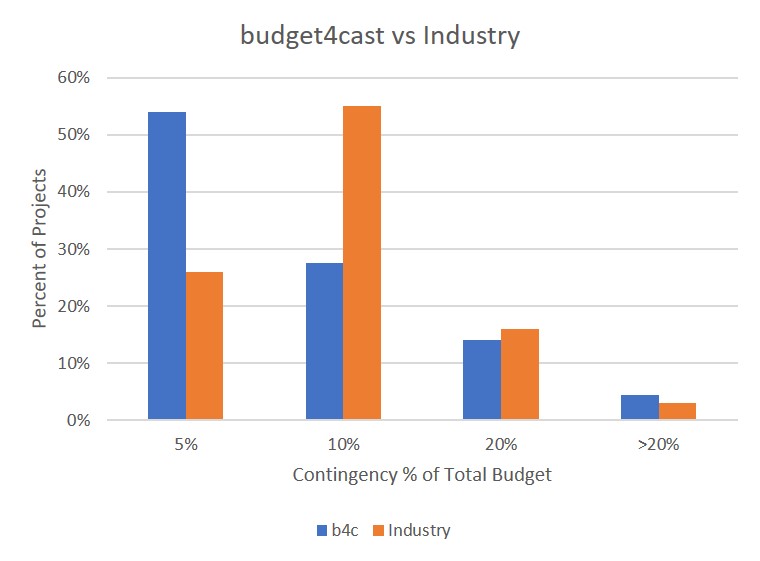
Another interesting finding, on construction projects managed within the budget4cast app, is in comparison with the overall construction industry. budget4cast users are more likely to use a lower contingency percentage on their construction projects, than the industry overall. budget4cast project managers are equally as likely as their counterparts in the construction industry to use a Contingency Percentage of 20% or more (roughly 18% of all projects.)